


As of May, the last epidemiological restriction will be lifted in Hungary. In this context, let’s take a look at how our key indicators have evolved compared to the “last year of peace”, using Eurostat data. It is interesting to note that the Covid19 pandemic was the most popular topic in the Economics Section of the OTDK (National Conference of Student Research Societies) this year.
The epidemic was directly present in Europe from spring 2020 until the end of 2021. It also challenged the economy in a way that generations living today had never faced before. Innovative responses to the crisis had to be provided as quickly as possible. There is already a wealth of material on the Internet on the measures available, and this article highlights the main impacts.
Excess mortality
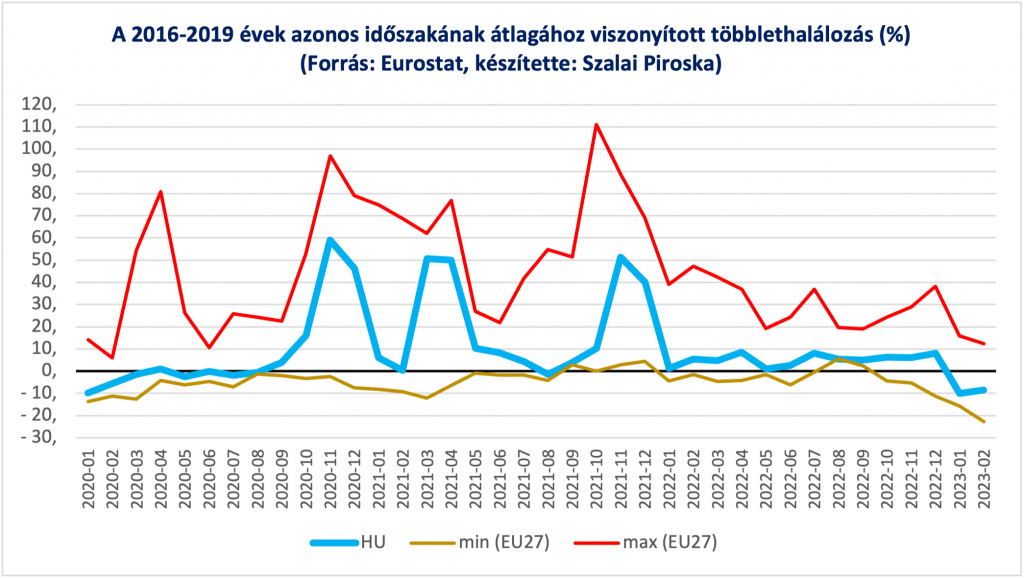
(Source: Eurostat, by: Piroska Szalai)
The excess mortality indicator shows the number of deaths in the current month compared to the average for the same month in 2016-2019. As the graph above shows, Hungary was never the Member State with the highest excess mortality in the EU in a given month, and most of the time we were among the states with the lowest. Our highest excess mortality (in November 2020) was below 60%, with 11 countries having peaks higher than the Hungarian maximum. In November 2020, the excess mortality rate in our region was much higher than here in five Member States.
Timely introduced control measures can clearly be considered effective based on the mortality data. We managed to “flatten and pull apart” the peaks that have extreme strain on our healthcare system; one may recall that this was a definite aim in how the epidemic was managed.
Employment rate
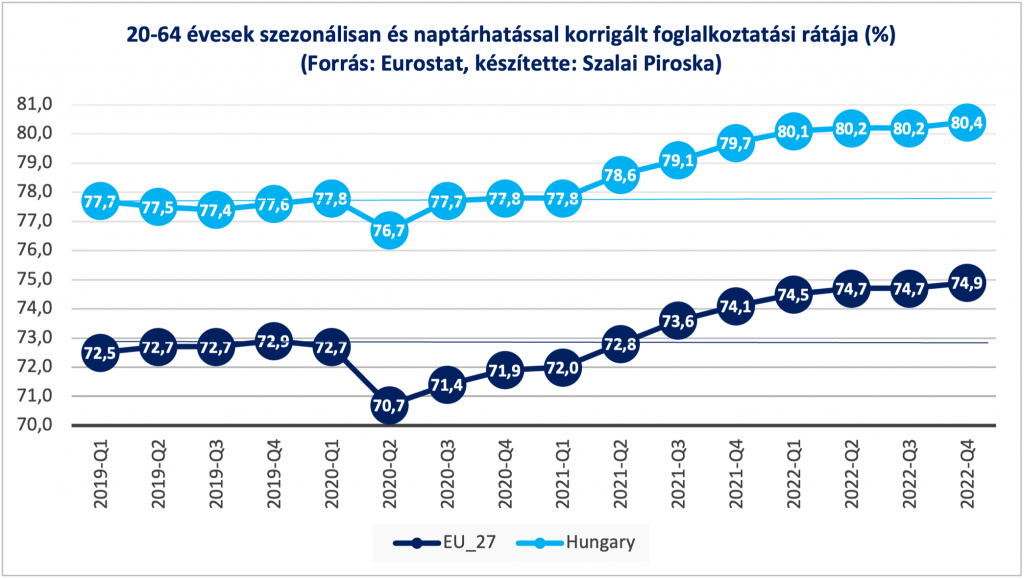
(Source: Eurostat, by: Piroska Szalai)
The quarterly employment data demonstrate that, in Hungary, the employment rate for 20-64 year olds was lower than in the previous quarter in only one quarter, while the EU average only returned to its pre-pandemic level by the fifth quarter. Our rate of decline (1.1 percentage points) was also well below the average (2 percentage points). The uptake of vaccinations in spring 2021 also increased the dynamics of the employment rate growth, both in our country and in the EU average.
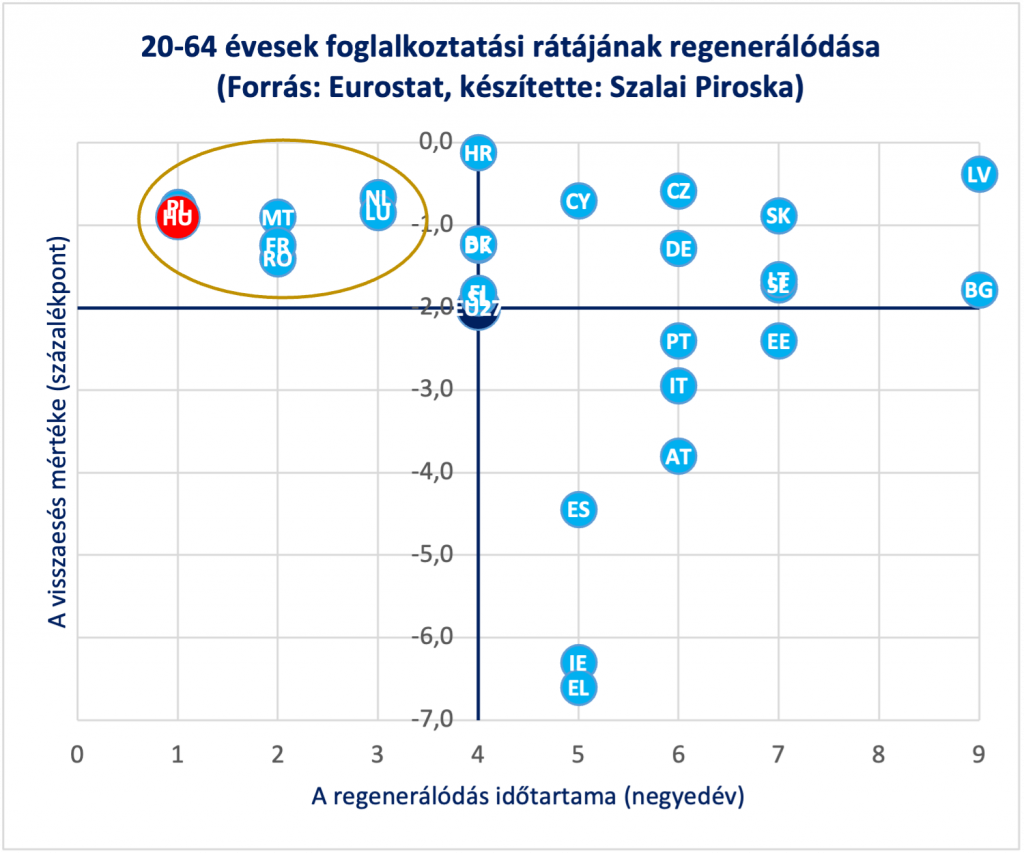
(Source: Eurostat, by: Piroska Szalai)
The graph above shows that only seven countries experienced a faster recovery and, at the same time, a lower decline than the EU average. Hungary and Poland had a decline in a single quarter; Malta, France and Romania had two quarters of decline, and Luxembourg and the Netherlands had three quarters of decline in their employment rates, reaching their pre-pandemic levels in the fourth quarter.
It can be said that the rapid action taken to protect jobs in our country was clearly effective, and we could now maintain employment levels. During the 2006-2010 financial crisis, it took much longer, years, to correct the decrease. The EU average also recovered faster than it did then.
In our country, the bounce-back also took place with a huge internal structural transformation in the labour market. All in all, in the meantime, the same quantity of jobs (or more) was created as had been lost.
Purchasing value of average wage
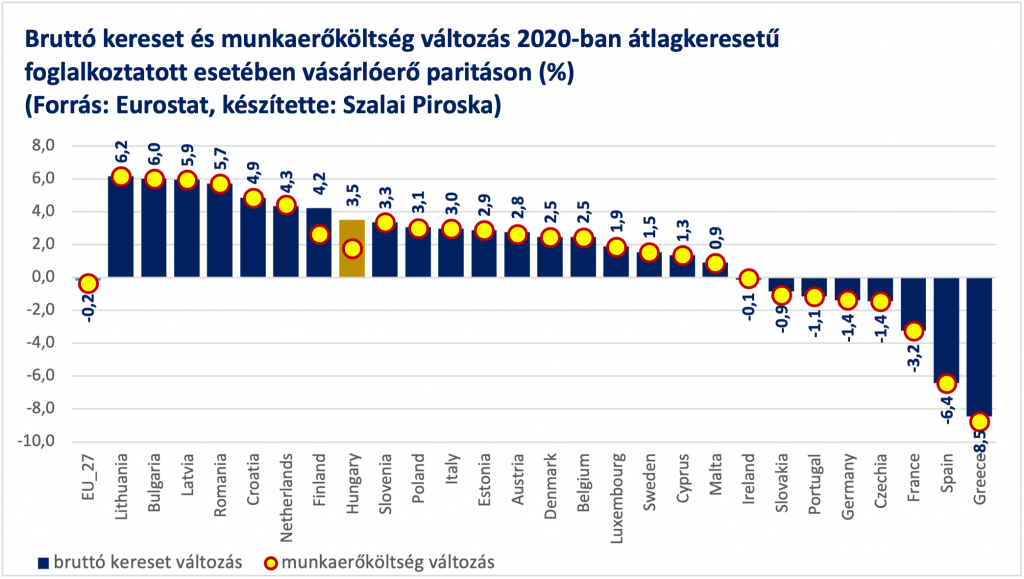
for an average wage earner at purchasing power parity (%)
(Source: Eurostat, by: Piroska Szalai)
For earnings, Eurostat provides average wage data for employees in enterprises with 10 or more employees; in other words, it does not cover employees in enterprises with fewer than 10 employees in the competitive sector, nor employees in budgetary institutions, nor employees in the non-profit sector.
In this group, real gross income fell on average in the EU and in 8 Member States, but we achieved an increase of 3.5%. Total labour costs per average wage earner increased in Hungary to a lesser extent than gross earnings because the social contribution tax paid by employers fell. Apart from Hungary, the change in labour costs was less than the change in gross earnings per worker in only Finland.
As one may recall, in 2020, average earnings for the entire workforce increased by 9.8%, with an 8% increase in the minimum wage and guaranteed minimum wage, and consumer prices rose by 3.3%, so we achieved a 6.3% increase in real income. As health workers received a one-off 500,000 HUF benefit in June this year, which increased the earnings of public sector workers, and workers in small firms are more likely to earn around the guaranteed minimum wage, this explains why, in parallel with the 9.8% average and 6.3% real income increase for the total workforce, there was a 3.5% real income increase for those working in firms with more than 10 employees, which means an almost 7% increase in average income.
Poverty or risk of social exclusion
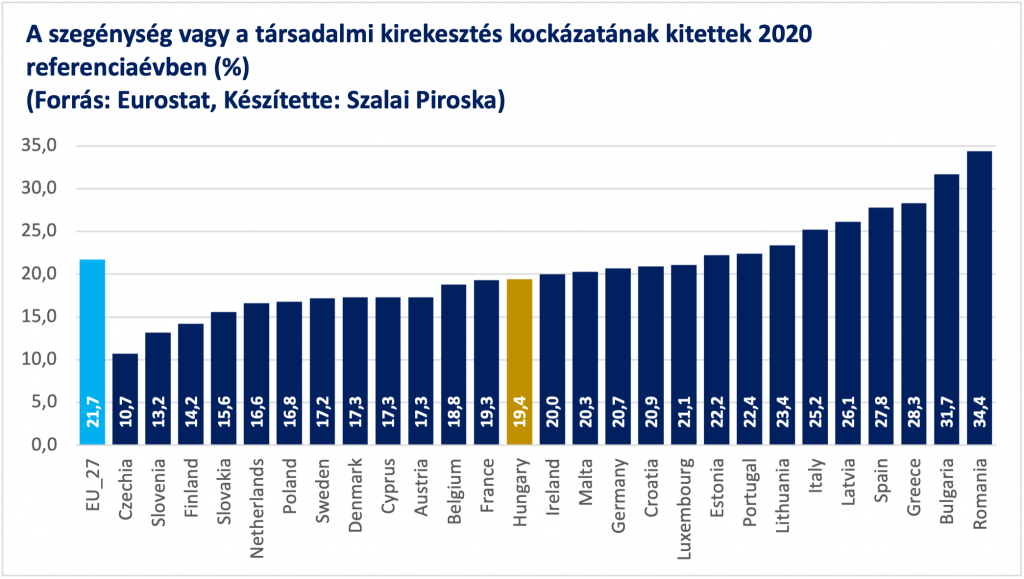
(Source: Eurostat, by: Piroska Szalai)
The proportion of people at risk of poverty or social exclusion, the indicator that best measures the financial situation of families, also increased in 13 Member States and the EU average in the reference year 2020. In Hungary, it remained unchanged at the 19.4% measured in 2019.
Summary
Our labour market was the fastest to recover; real income of workers not only did not fall, but rose, which contributed to the expansion of the national economy via household consumption, and the income situation of families did not deteriorate, and poverty did not increase during this period.
On average, it took longer for employment to recover in Member States, with a higher rate of decline, lower real income and an increase in the proportion of people at risk of poverty or social exclusion in 2020.
It is clear that our management of the epidemic, both on the healthcare side and on the labour market side, was much more effective than analysts had anticipated; and it was also more effective than it was during the financial crisis that started in 2006.